The Heatmap allows you to see which steps and paths of a process are most frequently used.
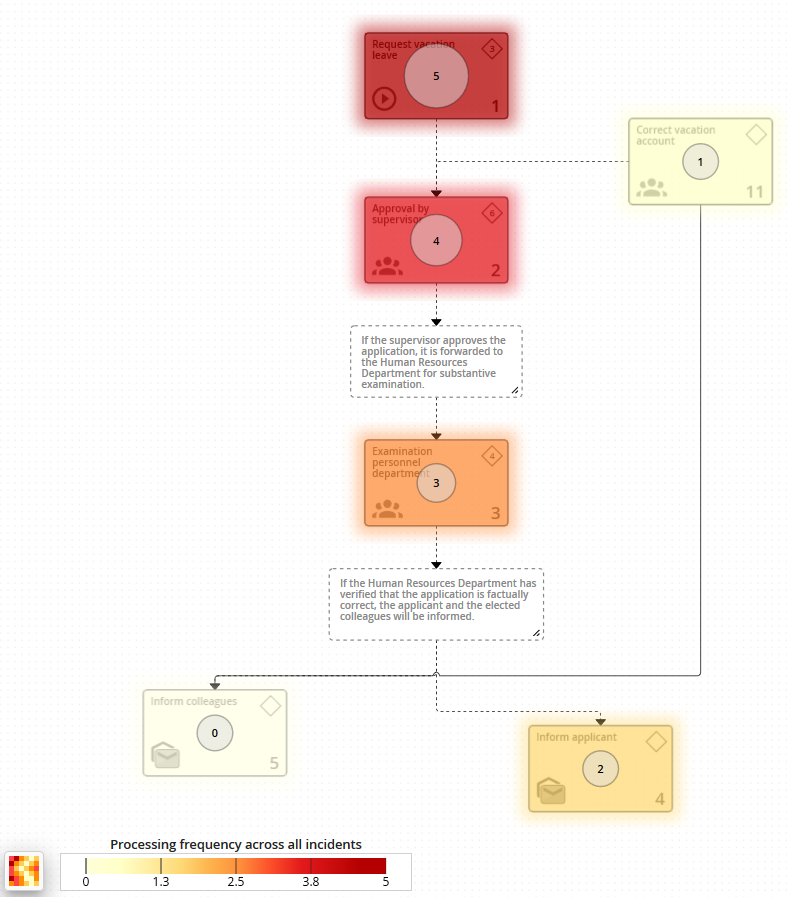
The Heatmap button gives you two ways to view statistics about a process:
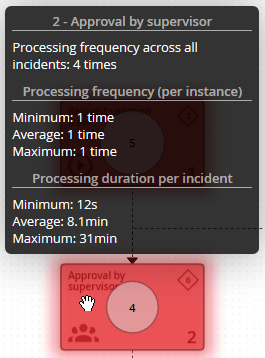
•Processing frequency across all incidents
•Processing duration per incident (Average)
In the case of a hover effect over a step, this data is also displayed in a popup.